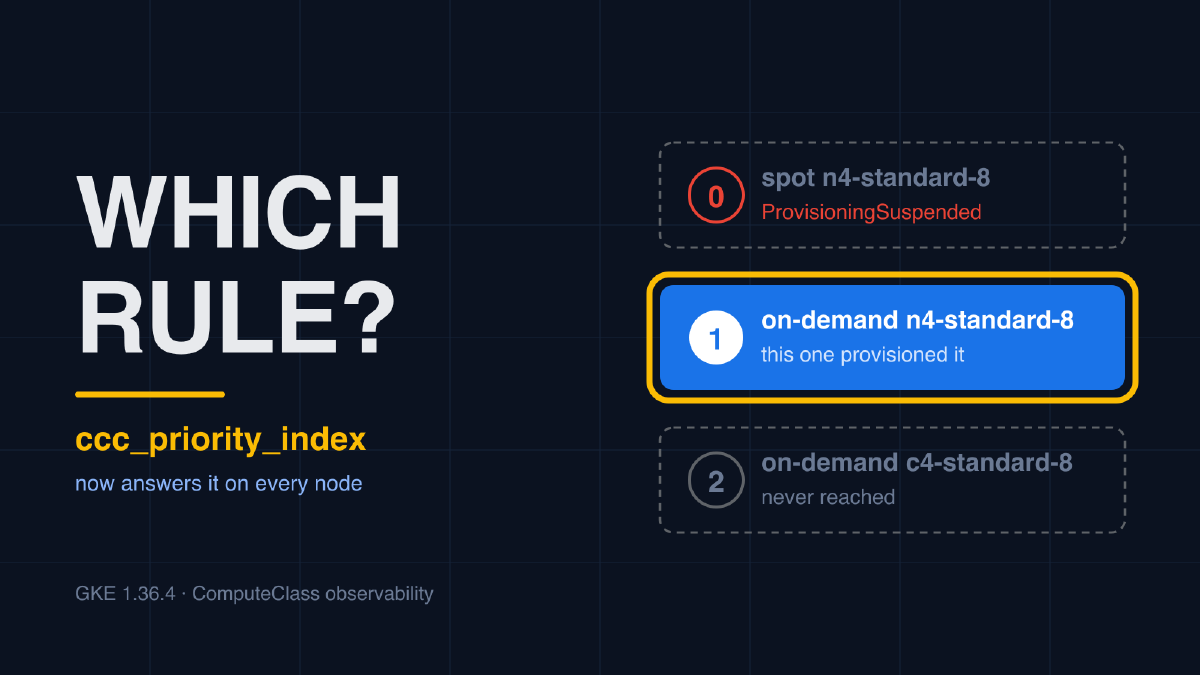
GKE 1.36.4 gives ComputeClasses a real status surface: per-priority conditions with backoff timers, a node annotation that names the priority rule that provisioned it, and an audit-log trail that outlives the nodes themselves. This has been the longest-standing gap in the API, and it’s worth an afternoon of your time to get functional with it.
I’ve spent five posts now arguing that ComputeClasses are an ordering API. You write a ranked list of the capacity you’re willing to run, the autoscaler walks it top-down, and each priority rule either succeeds or fails cleanly so the next one gets a turn. I still think that’s the right model.
Here’s the part I’ve been quieter about: until very recently, you could not see it happen.
You authored a five-rule class, applied it, and then the cluster did… something. Nodes
appeared. Were they priority rule 0, or rule 3? kubectl get computeclass gave you a
Health: True and essentially nothing else. So you reconstructed the answer by hand —
read node.kubernetes.io/instance-type off the nodes, check cloud.google.com/gke-spot,
infer which rule could have produced that shape, and hope two rules didn’t share a
machine type. If the shapes were ambiguous, you went digging in Cluster Autoscaler
visibility logs with a timestamp window and a prayer.
That’s not observability. That’s forensics with a flashlight.
GKE 1.36.4-gke.1391000+ closes it. There’s now a documented status surface on the CRD
and a documented annotation contract on every node. I’ve packaged the whole thing — manifests, three diagnostic scripts, mock
fixtures so you can see the output before you have an incident — into an
observability example
in the examples repo, and taught it to the
gke-compute-classes skill.
This post is the walkthrough. Less “here’s what shipped,” more “here’s how to be functional with it by the end of the afternoon.”
The three questions#
Strip away the API surface and the whole package answers three operational questions. They’re the ones that actually get asked in a thread at 11pm:
- Which priority tier provisioned the nodes my workload is running on?
- Did a rule hit a stockout — and when does its backoff expire?
- If pods are still
Pending, did every candidate rule fail?
Each maps to one of the pillars below. If you read nothing else, read the pillar that matches the question you’re currently being asked.
Pillar 1: per-priority status on the CRD#
The ComputeClass object now reports status.priorityStatuses[] — one entry per priority
rule, with live health, utilization, and scaling history.
The mapping rule is the important part: identifier is the 0-based index into
spec.priorities. The first rule in your YAML is identifier: "0".
That mapping holds for every class but one shape. whenUnsatisfiable: ScaleUpAnyway
appends status entries that aren’t in your array, which matters if you index into
spec.priorities with the identifier — it’s in Sharp edges at the end,
and you don’t need it to get started.
status:
  conditions:
  - type: Health
    status: "True"
    message: Crd is healthy.
  priorityStatuses:
  - identifier: "0"
    conditions: []
    resourceInfo:
    - name: cpu
      unit: Cores
      currentCount: 2
      targetCount: 2
      currentUtilizationPercentage: 16
      measuredAt: "2026-09-18T17:06:52Z"
    scalingEventsHistory:
      provisionedNodesCount: 1
      consolidatedNodesCount: 0
      migratedNodesCount: 0
      measuredSince: "2026-09-18T17:03:06Z"
  - identifier: "1"
    conditions: []
    resourceInfo: []
Three fields earn their place here:
- How hard each rule is working.
resourceInforeports, per rule, how much capacity is running and how heavily it is used — a current count, a target, and a utilization percentage, one entry per resource (CPU, memory, GPU, TPU). When the target runs ahead of the current count a scale-up is in flight; when it trails, a scale-down. This is the number you want when someone asks whether the expensive rule is earning its keep. One wrinkle for anyone parsing it: it’s a list, not a map, so you select an entry rather than key into one —.resourceInfo[] | select(.name=="cpu"). - What kind of churn you’re seeing.
scalingEventsHistorycounts nodes provisioned, consolidated, and migrated as three separate numbers. The migration count matters more than it looks: it’s how you tell a deliberateactiveMigrationapart from Spot preemption churn. - A summary for the whole class. Alongside the per-rule array, the class carries its
own conditions and its own aggregate
resourceInfo. The aggregate totals every rule, which is what a capacity dashboard wants. The conditions are the one-line “is this class working at all” signal:Healthflips toFalse, with a bluntCrd is not healthy., the moment any rule breaks. If you alert on one field in this entire release, alert on that one.
A quick one-liner to dump the whole surface:
kubectl get computeclass observability-class -o jsonpath='{range .status.priorityStatuses[*]}Priority [{.identifier}]:{"\n"}{range .conditions[*]} - Condition: {.type}={.status} ({.message}){"\n"}{end}{end}'Pillar 2: a conditions vocabulary with timestamps#
conditions: [] on a rule is the happy path. When GCE pushes back — stockout, quota,
exhausted subnet — GKE writes a typed condition onto the affected rule, and the message
carries the wall-clock time the backoff expires.
That timestamp is the single most useful thing in this release. “Priority rule 0 is backed off” is a fact; “rule 0 is backed off until 20:50 UTC” is a decision you can make.
| Condition | Scope | What it means |
|---|---|---|
ProvisioningSuspended | whole tier | The rule is backed off across every zone. The autoscaler won’t try it until the timer expires. |
ProvisioningConstrained | zonal / node pool | The rule failed in specific zones and those pools are cooling down. Healthy zones stay active on this tier. |
NodeProvisioningInProgress | tier | Instances requested from GCE. Message names the pool, machine type, and zones. Clears when nodes go Ready. |
MinCapacityProvisioning | tier | Proactive minimumCapacity floor provisioning started. |
MinCapacityProvisioned | tier | Floor fulfillment tracker — False/ProvisioningInProgress, then True/ProvisioningComplete. |
RuleMisconfigured | tier | The rule contains contradictory or unsupported parameters — bad sysctls, missing accelerator drivers. |
The suspended/constrained distinction is worth internalizing, because it changes what you do next.
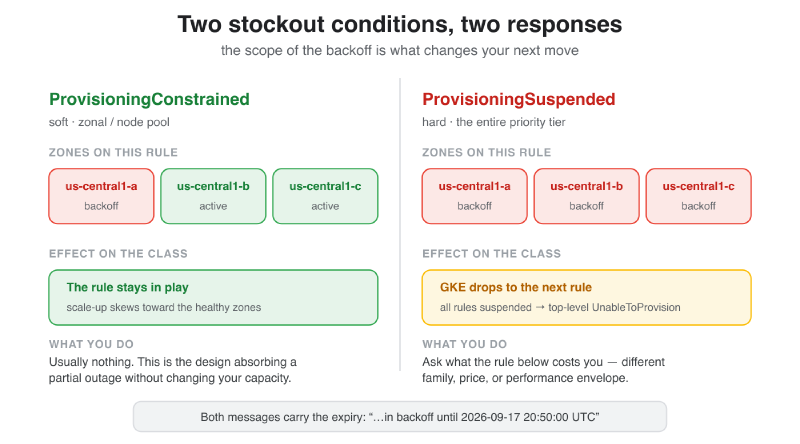
ProvisioningConstrained is a soft stockout. One zone ran out; the rest of the region
is fine. Your preferred rule is still your rule — scale-up just skews toward the healthy
zones. Usually you do nothing.
ProvisioningSuspended is a hard stockout on that tier. The whole rule is out,
everywhere, until the timer. GKE drops to the next rule, and that’s the design
working. You only care if the rule below is meaningfully worse — different family,
different price, different performance envelope — which is exactly the sort of thing you
want to know before someone else notices it in a latency graph.
And when every rule is suspended and ScaleUpAnyway isn’t in play, the top-level
status.conditions[] sets UnableToProvision. That’s the hard stockout signal: one
condition, on one object, instead of a pile of Pending pods and a hunch.
To scan for live backoffs:
kubectl get computeclass observability-class -o json | jq -r '
  .status.priorityStatuses[] |
  select(.conditions[]? | (.type == "ProvisioningSuspended" or .type == "ProvisioningConstrained") and .status == "True") |
  "Priority " + .identifier + " in backoff: " + (.conditions[] | select(.type=="ProvisioningSuspended" or .type=="ProvisioningConstrained") | .message)
'
Pillar 3: the node annotation contract#
This is the small one that closes the loop, and it’s my favorite piece of the release.
Every node the autoscaler provisions for a ComputeClass carries
metadata.annotations.ccc_priority_index — the priority rule that provisioned it. Not the
shape it happens to be. The rule. No inference, no shape-matching, no ambiguity when two
rules share a machine type.
And unlike the other two pillars, this one is not new in 1.36.4. I bisected it across live clusters after the fact, because the annotation is undocumented and I didn’t want to guess: it is absent on 1.31.14 and 1.32.13, and present on 1.33.13 and everything after. So the floor is 1.33 — at or below the minimum version of every active release channel. If you’re reading this wondering whether you’ll have to plan an upgrade to use it: you almost certainly already have it.
| Value | Means |
|---|---|
"0", "1", "2", … | The 0-based rule in spec.priorities that provisioned this node. |
"ccc_scale_up_anyway" | Every rule failed; GKE fell back to a default shape (typically e2) under ScaleUpAnyway. |
"ccc_no_rule_matching" | The class still exists, but no rule in it matches this node — including the case where the rule that provisioned it was removed from spec.priorities. |
"ccc_deleted" | The ComputeClass object itself is gone, and this node outlived it. |
Those last two are the sleeper value, and the distinction between them is narrower than
the names suggest — I had it backwards until I tested it. I provisioned a node on priority
rule 1, then deleted that rule from spec.priorities. The annotation became
ccc_no_rule_matching, not ccc_deleted. Then I deleted the whole ComputeClass, and
that is when it flipped to ccc_deleted.
So: ccc_no_rule_matching is your config-drift detector — nodes still running under a
rule you’ve edited out of your YAML — and ccc_deleted is the narrower “this node
outlived its entire class” case. If you’ve ever changed a class in place and wondered
what was still out there from the old version, ccc_no_rule_matching is the answer, and
it’s one kubectl get nodes away:
kubectl get nodes \
  -o custom-columns=NAME:.metadata.name,CCC:.metadata.labels.cloud\.google\.com/compute-class,PRIORITY_INDEX:.metadata.annotations.ccc_priority_index,ZONE:.metadata.labels.topology\.kubernetes\.io/zone,TYPE:.metadata.labels.node\.kubernetes\.io/instance-type
Here’s that command against a live cluster of mine — a spot-history-demo class whose
rule 0 is Spot c2-standard-4 and rule 1 is Spot n2-standard-4:
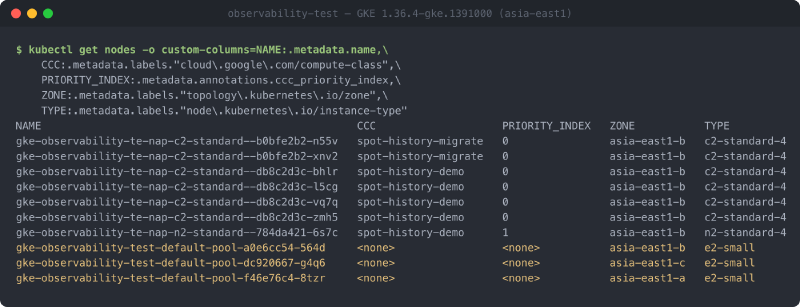
Read the PRIORITY_INDEX column top to bottom and the class’s behaviour is just there.
Six nodes came from rule 0. One node — the n2-standard-4 — came from rule 1, which means
that when it was provisioned rule 0 could not be satisfied and GKE walked down to the next
rule. That single digit is the whole story, and nothing else in the output would have told
you: I’d have had to notice the odd machine type and reason backwards to the rule that
could have produced it.
Note the bottom three rows too. The default-pool nodes carry <none> in both columns — no
compute class, so no annotation. The column is scoped to the nodes the ComputeClass
autoscaler provisioned, which is exactly what you want when you’re separating “capacity my
class delivered” from “capacity that was already there.”
One timing detail worth knowing: the annotation is written a beat after the node registers. It’s stamped on after the node object exists rather than being part of it at creation, so it needs a moment to land. Here’s the same command run twice, sixteen seconds apart, while a fresh node was coming up:
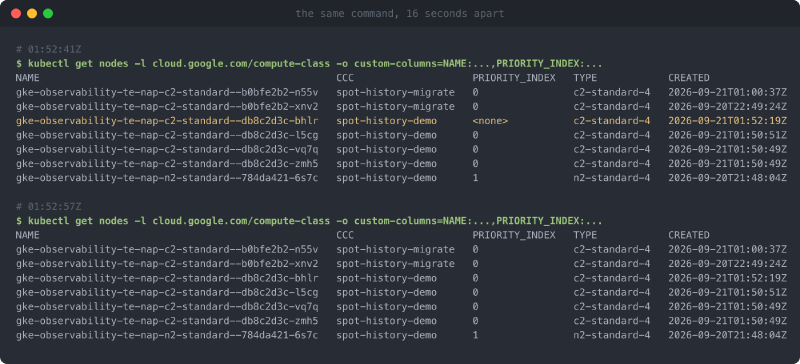
One cell changes. The node was created at 01:52:19Z, still had no annotation at
01:52:41Z, and was stamped by 01:52:57Z — so somewhere between 22 and 38 seconds after
it appeared.
Don’t read that as the number, though, because the gap isn’t a constant. The component that writes the annotation reconciles on a one-minute cycle, so what you’re really measuring is where your node landed inside that cycle. On earlier scale-ups I timed the same thing by comparing node creation timestamps against the audit entry for the annotation write, and got 57 and 62 seconds. Same mechanism, different point in the loop. The useful form of the claim is the bound: expect up to about a minute, and don’t be surprised by either end of it.
The trap is that nodes are Ready and pods are already scheduling through that entire
window, so if you’re watching a scale-up in real time you will hit it.
Pillar 4: audit logs and the history problem#
Live status is great right up until the evidence evaporates. Kubernetes pod events expire after about an hour. Ephemeral nodes scale to zero and take their annotations with them. The incident review happens the next morning.
So the package has a third layer, aimed squarely at after the fact.
Cloud Audit Logs are that layer, and this is the trick I’d most want someone to
steal from this post. GKE writes ComputeClass status transitions to the audit log, which
means historical priorityStatuses survive long after the live object has moved on:
# Historical priority suspensions and resourceInfo snapshots
resource.type="k8s_cluster"
protoPayload.resourceName:"cloud.google.com/v1/computeclasses/COMPUTECLASS_NAME"
protoPayload.methodName:"com.google.cloud.v1.computeclasses.status"

# The ccc_priority_index of a node that has already been deleted
resource.type="k8s_cluster"
protoPayload.methodName=("io.k8s.core.v1.nodes.patch" OR "io.k8s.core.v1.nodes.update")
protoPayload.resourceName:"nodes/NODE_NAME"
Expand protoPayload.request.status on the first and you get the rule-by-rule state as it
was during the incident. Expand protoPayload.request.metadata.annotations on the second
and you get the priority index of a node that no longer exists. Yesterday’s stockout
becomes answerable.
This is also the answer to the question platform engineers ask first: will any of this
surface as Kubernetes events? Deliberately, no. Kube events are best-effort — they’re
rate-limited, they expire in about an hour, and under exactly the kind of pressure that
produces a stockout they’re the first thing to get dropped. That’s a poor foundation for
the signal you reach for mid-incident. Cloud Audit Logs are stable and predictable: they
persist on their own retention, they’re queryable long after the node and the condition
are both gone, and they don’t quietly thin out when the cluster is busy. If you want an
event stream out of this, build it off a log sink rather than off kubectl get events.
The use cases, and the scripts that run them#
Most of that surface is stuff you query, and the examples repo ships three
dependency-light scripts that do the querying for you — bash and jq, plus the kubectl
and gcloud you already have. Two of them are the subject of this post; the third covers
proactive minimumCapacity floors, which are a different enough problem that they get
their own post. They correlate the CRD status, CA
visibility logs, node attributes, and pod warning events into one report — which is a lot
of jq you don’t have to write at 11pm.
They run in two modes. On 1.36.4-gke.1391000+ they read status.priorityStatuses[]
directly. On older control planes they fall back to live inference — correlating
spec.priorities against visibility logs, node labels, and FailedScaleUp events scoped
to pods targeting the class. Not as precise, but it works before you’ve rolled the
upgrade, which is where most people reading this actually are.
One note on the two reports below. Both are the real output of the scripts, captured verbatim — but they’re run against the shipped mock fixtures rather than a live stockout, and I want to be exact about which half is which. The report structure, the field names, the section ordering, the runbook: all real, and all reproducible on your machine in thirty seconds with the commands in the next section. The scenario — which rule backed off, for what reason, until when — is fixture data. You can’t summon a regional capacity shortage on demand, and I wasn’t willing to manufacture one by burning accelerator quota to prove a point.
Everything else in this post — the node tables, the annotation timing, the
misconfiguration — is live capture off a real 1.36.4-gke.1391000 cluster.
Use case 1: pod-to-node traceability#
“Which priority rule is this thing running on, and why not the one above it?”
The chain has four hops, and the point of the release is that every hop is now addressable:
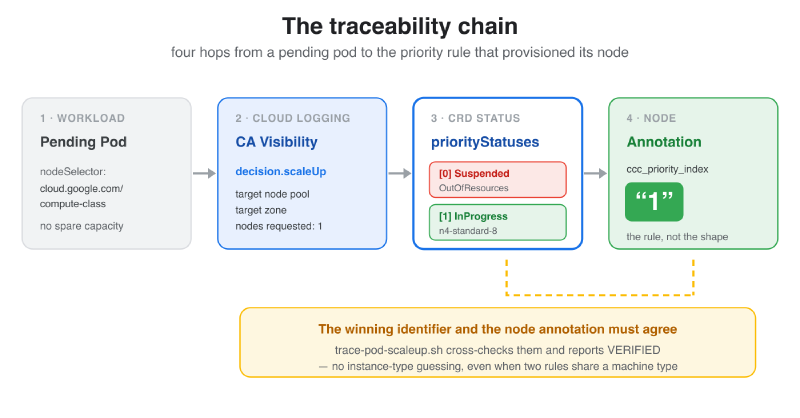
trace-pod-scaleup.sh walks it end to end:
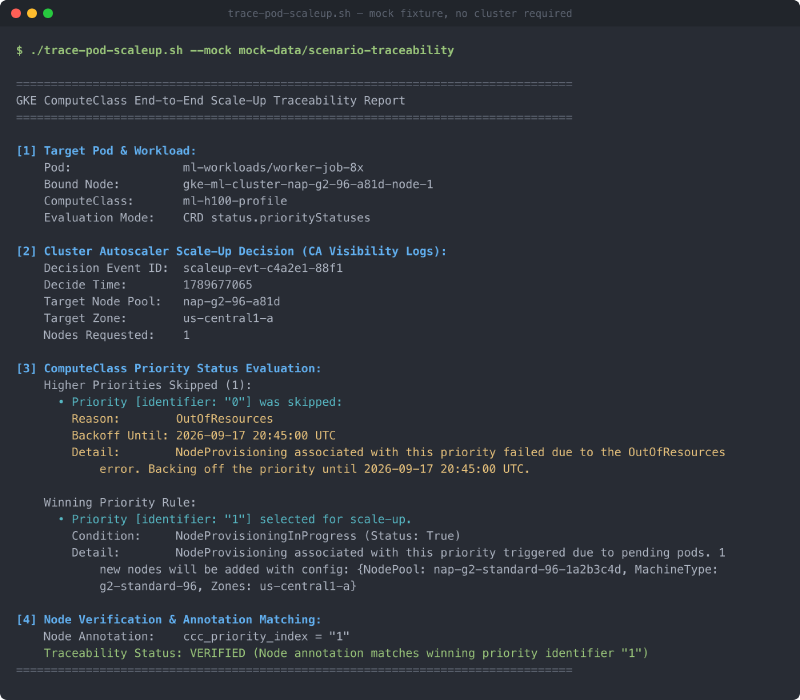
Skipped, why, until when, what won, and the node annotation cross-checked against it. That report is the entire reconstruction exercise I described at the top, automated.
Use case 2: hard stockout detection#
“Everything is Pending. Is this us or is this the region?”
monitor-hard-stockouts.sh answers it, and answers the follow-up question too:
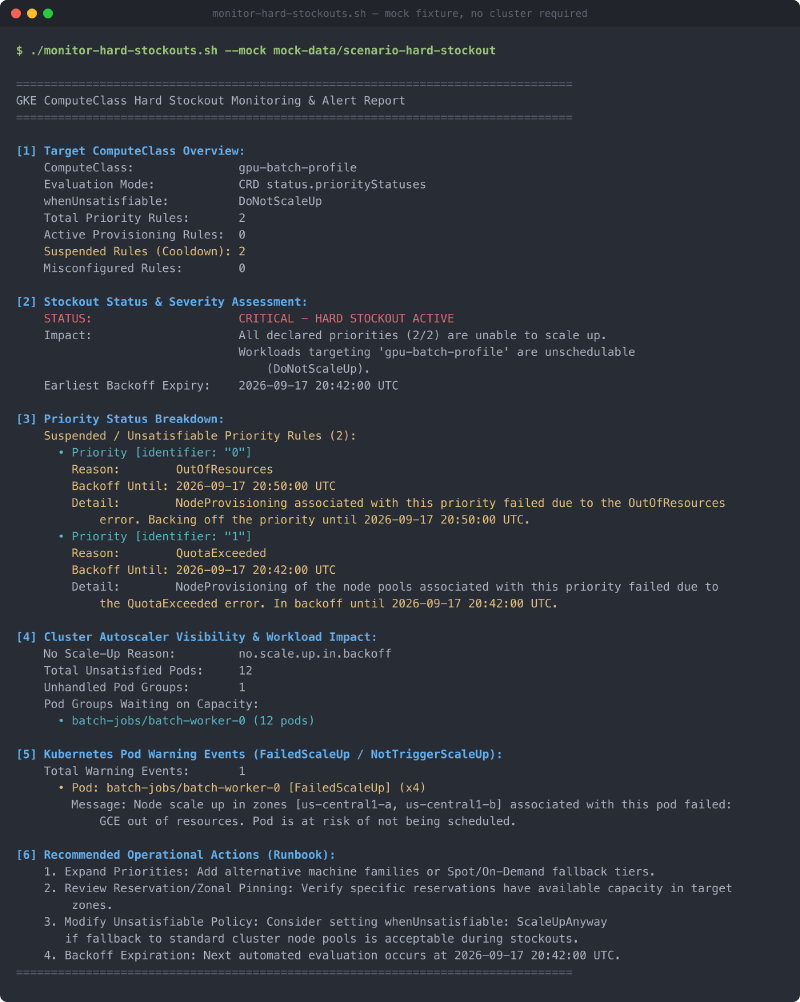
Note the two different reasons. Priority rule 0 is a genuine regional stockout — nothing
to do but wait or add a rule. Rule 1 is QuotaExceeded, which is yours — a limit inside
your own project rather than a shortage in the region.
That distinction is about who owns the problem, not about how fast it goes away. Quota increases are sometimes a self-service click and sometimes a support case that sits for days, depending on the quota, the region, and how much you’re asking for; GPU and TPU quota in a popular region can be the hardest ask in the building. The point is that one of these two has a path and the other only has a timer. Same symptom, completely different response, and before this release the pod events made them look identical.
The script closes with a runbook and the earliest backoff expiry, which is usually the number the person who paged you actually wants.
Use case 3: the priority rule that was never going to work#
Not every provisioning failure is a stockout. Sometimes the rule is simply wrong — a machine type that doesn’t exist in your region, an accelerator the zone never offered — and this is the failure mode where the old tooling actively misled you.
I set up the broken case deliberately, on a real cluster in asia-east1: a two-rule class
asking for m2-ultramem-208 then m2-megamem-416, neither of which exists in that region.
Here’s what the pod told me:
Normal NotTriggerScaleUp Pod didn't trigger scale-up: 26 node(s) had untolerated taint(s)That is a red herring, and note that it isn’t even a Warning — it’s Normal, so it
won’t stand out in a stream of events. Taints have nothing to do with the problem. The
autoscaler is reporting the last predicate that failed against the existing nodes, having
never gotten far enough to tell you the rules themselves are unsatisfiable. Chase that
message and you’ll spend an hour on tolerations.
The CRD says what actually happened — on the class, and on each rule:
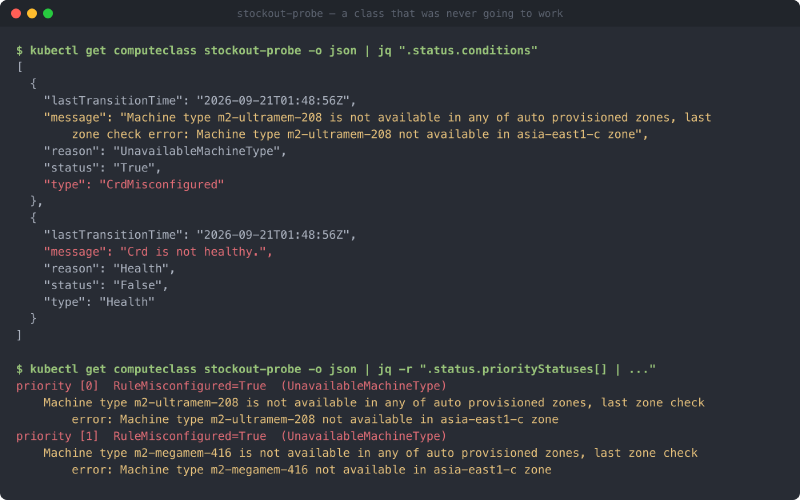
Two things to take from that. The class-level condition names one machine type —
m2-ultramem-208, the first rule’s — and flips Health to False. If you stopped there
you’d fix rule 0, re-apply, and rediscover the identical problem on rule 1. The per-rule
priorityStatuses[] is where you learn that both rules are bad, each with its own
RuleMisconfigured condition naming its own machine type. One read, complete answer.
monitor-hard-stockouts.sh buckets these separately — Misconfigured Rules: 2 rather than
lumping them in with backoffs — which is the right call, because a misconfiguration never
expires on its own. No timer is going to save you.
The related case is a migration that stalls: activeMigration pulling workloads back to
rule 0 after a stockout clears is the right instinct, and a restrictive PDB or a
safe-to-evict: false annotation can quietly stop it. There’s no dedicated drift object
for that — compare scalingEventsHistory.migratedNodesCount against
consolidatedNodesCount to tell a deliberate migration apart from ordinary scale-down
churn, and use the ccc_deleted annotation from Pillar 3 to find nodes still running
under a rule you’ve already removed.
Try it without an incident#
The best thing about these scripts, for getting functional specifically, is that all three ship with mock fixtures. You don’t need a cluster, a stockout, or a 1.36.4 control plane to see what a report looks like:
git clone https://github.com/vszal/gke-custom-compute-class-examples.git
cd gke-custom-compute-class-examples/observability/scripts
./trace-pod-scaleup.sh --mock mock-data/scenario-traceability
./monitor-hard-stockouts.sh --mock mock-data/scenario-hard-stockout
./verify-minimum-capacity.sh --ccc reserved-inference-profile --mock mock-data/scenario-min-capacity
Three scenarios, three reports, thirty seconds — the third being the minimumCapacity
one I’ll come back to separately. Read the output once now and you’ll
recognize it when it matters. There’s also a test-scripts.sh regression suite over the
same fixtures if you want to modify the scripts for your own environment.
The example class in
observability-class.yaml
is deliberately shaped to generate these signals: Spot n4-standard-8 at rule 0,
On-Demand n4-standard-8 at rule 1, On-Demand c4-standard-8 at rule 2, with
whenUnsatisfiable: DoNotScaleUp. That last choice is on purpose — strict failure
produces a clean UnableToProvision you can alert on, rather than a silent slide into
default e2 shapes that only shows up as a performance mystery three days later.
Sharp edges#
Everything above is the path that works. What follows is the short list of places where the obvious thing is wrong. All three bite hardest when you’re writing automation rather than reading output by hand, and none of them are in your way on day one — come back to this section when you start building against the surface rather than just looking at it.
ScaleUpAnyway adds entries that aren’t in your array#
The 0-based mapping holds for every class until you set whenUnsatisfiable: ScaleUpAnyway,
and then it’s a sharper edge than the docs let on. I expected one extra entry with
identifier: "ScaleUpAnyway". What I actually got, on a class with exactly one
priority rule, was three entries:
identifier=0             conds=RuleMisconfigured
identifier=1             conds=NodeProvisioningInProgress
identifier=ScaleUpAnyway conds=
There is no spec.priorities[1]. GKE appends an implicit numeric entry past the end of
your array for the generic fallback, and that entry carries the provisioning conditions
— while the synthetic ScaleUpAnyway entry sat empty the whole time. The node it
provisioned came back e2-medium with ccc_priority_index: ccc_scale_up_anyway.
The practical consequence: don’t write spec.priorities[$identifier]. Under
ScaleUpAnyway that indexes off the end of the array, and the entry named
ScaleUpAnyway is not the one doing the work. Match on the identifier string, and treat
any numeric identifier >= len(spec.priorities) as the generic fallback.
A missing annotation is not ccc_no_rule_matching#
Don’t write a controller that reads an absent ccc_priority_index as
ccc_no_rule_matching. That’s a real value with a real meaning — the class exists, but no
rule in it matches this node — and “not stamped yet” is not it. The annotation lands up to
about a minute after the node registers, and the node is Ready and scheduling pods that
entire time. Re-read instead.
nodes.create will not show you the annotation#
To pull a deleted node’s priority index out of the audit log you query
io.k8s.core.v1.nodes.patch and nodes.update, as in Pillar 4. The obvious guess is
nodes.create, and it returns nothing useful — for the same reason the annotation lags
the node. At create time the
annotation isn’t there yet, so the create entry shows you a node with no priority index.
The write lands in the patch that follows. If you’re tallying rather than
spot-checking, deduplicate by protoPayload.resourceName: a single node’s annotation can
appear in both a patch and an update, and counting entries will roughly double your
numbers.
And in the skill#
The other half of “getting functional” is that you shouldn’t have to remember any of
this. The gke-compute-classes skill
— one of the two I wrote up here — now carries the whole
contract: the status schema, the authoritative condition table, the annotation values, and
step-by-step recipes for each of these use cases in
references/compute-class-debug.md.
The three scripts ship as skill assets too, so the agent reaches for them instead of
improvising a jq pipeline.
npx skills add vszal/skillsWhich means the 11pm version of this is now: “pods targeting inference-class are
Pending, figure out why” — and the agent checks the version gate, reads
priorityStatuses, spots that rules 0 and 1 are both ProvisioningSuspended with one
OutOfResources and one QuotaExceeded, and tells you which half is actually yours to
chase.
That’s the workflow I wanted when I started writing these down.
The honest part#
This has been a long time coming. An ordering API you can’t observe the ordering of asks a lot of trust, and for the last several releases the honest answer to “which rule won?” was go read the instance types and guess. That was a fair thing for customers to be frustrated about, and they said so — consistently, and for a while. This release is the answer to that feedback.
So the version gates are worth saying plainly, and they are not the same gate. The
status surface — priorityStatuses[], the conditions, the whole of pillars 1 and 2 —
needs 1.36.4-gke.1391000+. The node annotation needs only 1.33. Below
1.36.4 the scripts’ inference mode softens the landing, but it’s inference — correlation
across logs and labels, not a contract. Below 1.33 there is nothing to read at all.
That split matters more than it looks. The most durable thing in this release is the piece with the lowest floor: if all you want is which rule won, you can have it today on a cluster you have not touched in a year.
What I’d still like: the conditions are point-in-time, so a fast backoff-and-recover can
pass between polls entirely — audit logs are the workaround, not a replacement for an
event stream. There’s also no fingerprint of the rule in status, so “is the class running
in my cluster the one in my repo?” is still a kubectl diff, not a field comparison.
But the shape is right, and — more to the point — the answer to “which priority rule
provisioned this node?” is now a column in kubectl get nodes instead of an afternoon.
If you’re running multi-rule classes in production, the observability
example
is worth twenty minutes this week. Start with the mock fixtures; you’ll know what you’re
looking at the first time it’s real.
We think this lands in a genuinely useful place, but the gaps above are the ones I
happened to hit. The feedback that actually moves this forward is the kind anchored in a
real workload: the question you couldn’t answer during an incident, the alert you wanted
to write and couldn’t, the field you went looking for in status and didn’t find. Leave
it in the comments or open an issue on the examples repo. That’s what shapes what lands
next.